Noble Lies Leads To Pump And Dump
In the January comment Noble Lies And Muddy Brains, the concept of "noble lies" were discussed.
In politics a noble lie is a myth or untruth, often, but not invariably, of a religious nature, knowingly told by an elite to maintain social harmony, particularly the social position of that elite.
For over twelve months, quite a few folks suspected governmental duplicity, that is deliberate deceptiveness, as to why they kept getting told how the recovery is taking hold, that the green shoots were appearing and everything's fine, so there's no need to own gold or silver. To those folks, those stories didn't relate to their actual experience. Why did they keep hearing this nonsense from mass-media sources?
Now this pump and dump story finally gets told, as posted May 26th by AP:
Treasury gets $6.2 billion from Citigroup salesand Bloomberg:
Treasury says sale of 1.5 billion shares of Citigroup stock brings government $6.2 billionWASHINGTON (AP) -- The Treasury Department said Wednesday it raised $6.2 billion from the sale of 1.5 billion shares of Citigroup stock it received as part of the government's rescue of the bank. The sales took place over the past month and represented 19.5 percent of the government's holdings of Citigroup common stock. Treasury said it has triggered a second round of stock sales through its agent, Morgan Stanley. That will involve an additional 1.5 billion shares.
Treasury Sells 20% of Citi Stake for $6.2 BillionOkay, let's analyze what has happened to Citigroup's stock.May 26 (Bloomberg) -- The U.S. Treasury Department sold 20 percent of its shares in Citigroup Inc. at a profit during the past month and authorized adviser Morgan Stanley to keep selling under a pre-arranged plan.
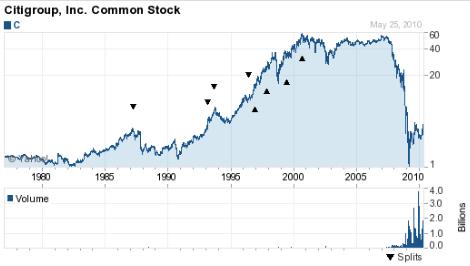
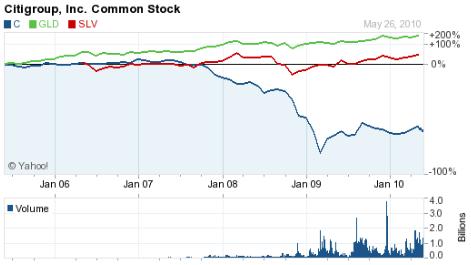
[All charts came from http://finance.yahoo.com/q/bc?s=C&t=my&l=on&z=m&q=l&c=]
First, this chart reflects Citigroup's stock over the long term.
You can see how it started to be inflated in the early 1980s.
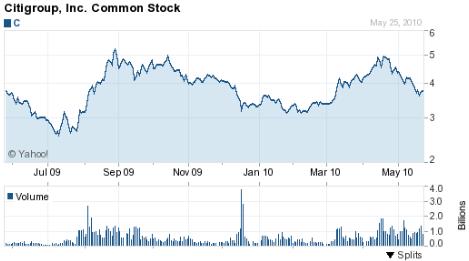
Next is this two-year chart, showing it crashing with everything else in March of 2009.
It also shows the stock re-acting to it's shot of adrenaline,
in the form of T.A.R.P..
I'm sure the legislators heard from Wall Street,
"Hey, we've done this before, we can do it again.
Just give us the play money."

This one-year chart shows a great amount of shares changing hands in December.
Looks like someone is getting ready for something.
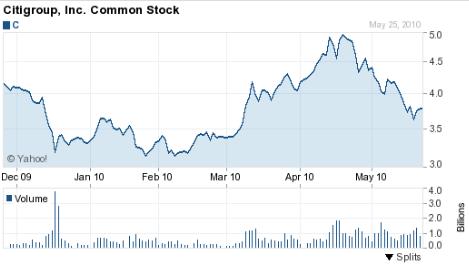
This six-month chart shows the trading range was stuck for a while.
The pumping looks like it began in February.
Last but not least, the three-month chart shows quite clearly,
the pump and dump.
Wonderful timing, wouldn't you say?
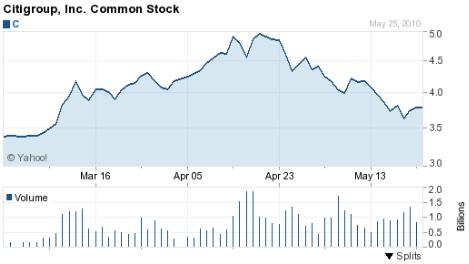
The Bloomberg article above figures the government averaged $4.13 per share.
On May 26th, Citigroup opened at $3.97, and closed at $3.78.
I can't help but wonder how those folks whose retirement funds, mutual funds,
and others
that recently bought Citigroup shares feel,
now that they know their government got them in the wallet, again.
Just one more chart to illustrate why those who wish to rob you
of your savings tell you that [physical] gold and silver investments
are of high-risk. They simply want your money where they can take it without confrontation.
Their "noble lies" are not so noble.
So you should consider what GATA.ORG has to say!
Just another reason that
Sometimes
The Dragon Wins
© 2010 by Edward Ulysses Cate
Help Support This Site
Commentary Index
Home